
An important story thatŌĆÖs emerging in what are hopefully the winding-down days of the pandemic concerns supply shortages and cost hikes. The all-items U.S. Consumer Price Index (CPI), which has been consistently under +2.0% year over year for an extended period, suddenly shot up to +4.2% y/y in April, as a result of moving +0.8% in just one month.

As everyday shoppers, you and I may feel we have something to gripe about. But consider the plight of the unfortunate contracting community. Our soaring expense frustrations pale beside what beleaguered contractors are facing.
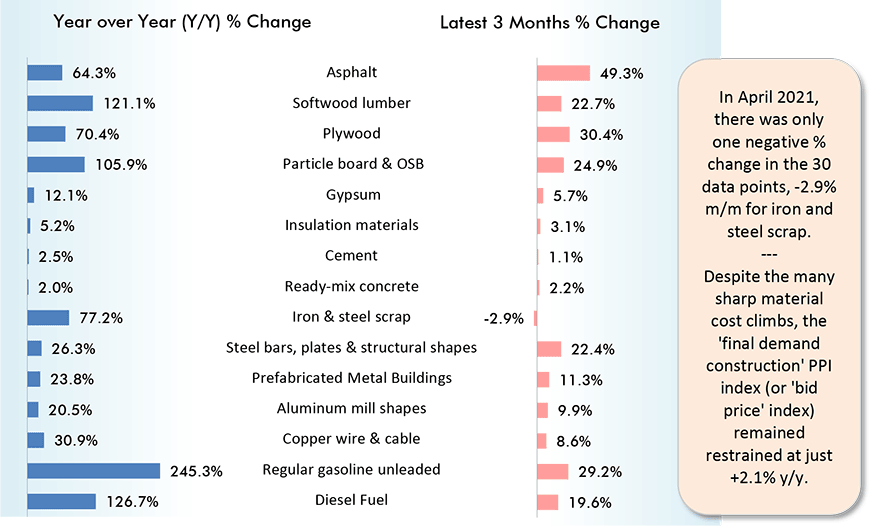
Table 1 shows y/y and latest-three-month price hikes for 15 major construction materials and some of the key ingredients of building products (e.g., aluminum in ventilation systems).
Table 1 is a subset of Table 2 which appears at the end of this article and includes a comprehensive list of construction material inputs and special indices. All the numbers come from the Producer Price Index (PPI) data set compiled by the Bureau of Labor Statistics (BLS).
Among the 15 items in Table 1 and for the year-over-year and month-to-month time frames, thereŌĆÖs only one instance of a declining index value, -2.9% m/m for iron and steel scrap. But also notice that iron and steel scrap on a y/y basis is +77.2%.
Four items in the left-hand column of Table 1 have more than doubled in price over the past year: softwood lumber, +121.1%; particle board & OSB, +105.9%; regular gasoline, +245.3%; and diesel fuel, +126.7%.
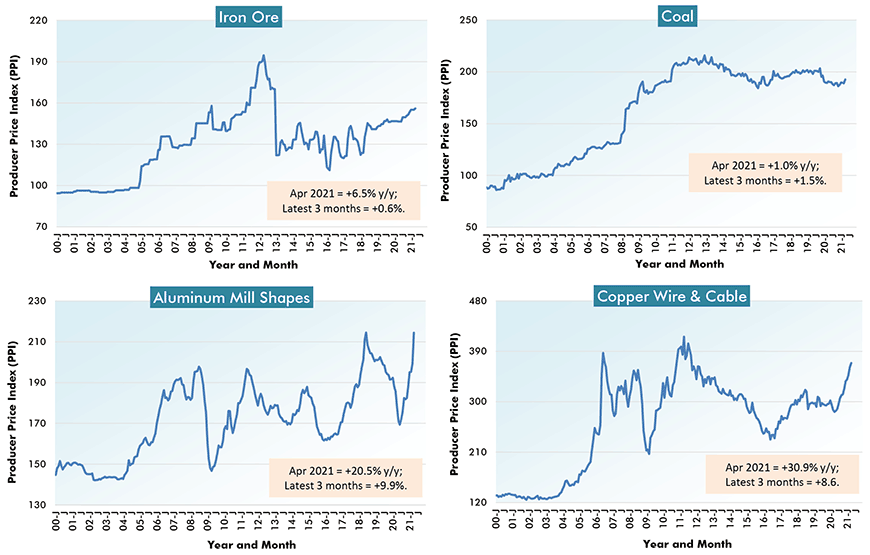
The upwards adjusting ŌĆśforestryŌĆÖ and ŌĆśsteelŌĆÖ product price movements have been ongoing for a while. More recently piquing our interest, though, have been the accelerating price trends for aluminum mill shapes and copper wire and cable. The former is +20.5% y/y and +9.9% m/m; the latter, +30.9% y/y and +8.6% m/m.
On the principle, that itŌĆÖs often easier to grasp what is occurring when one sees a picture, cluster-graphs 1 through 6 show the history of the price indices for 24 of the PPI construction-related material indices.
From Producer Price Index (PPI) Series – April 2021
Charts: ║┌┴Ž╔ńConnect.
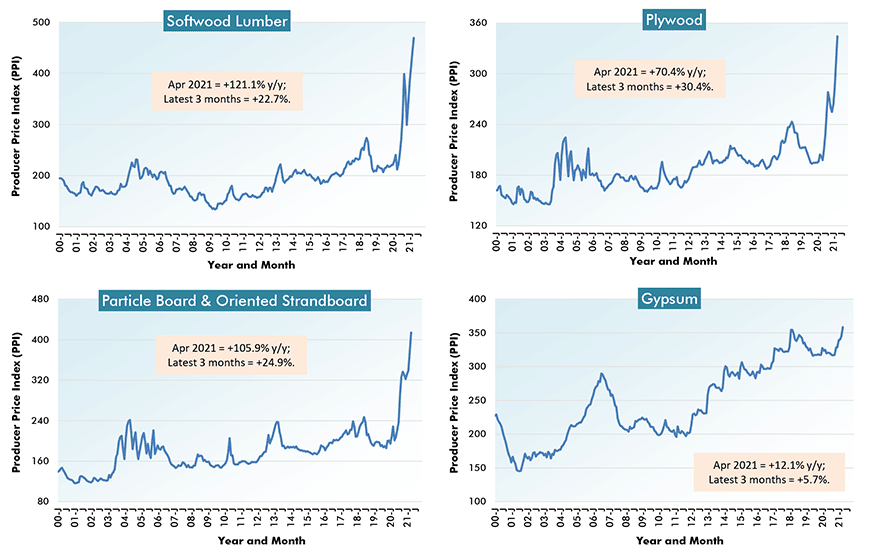
Forestry Products & Paneling
In Graph 1, the softwood lumber, plywood and particle board/OSB price index curves have been skyrocketing of late and reaching new summits. Gypsum, while not launching into orbit in quite the same dramatic fashion, is still elevated relative to its history.
Charts: ║┌┴Ž╔ńConnect.
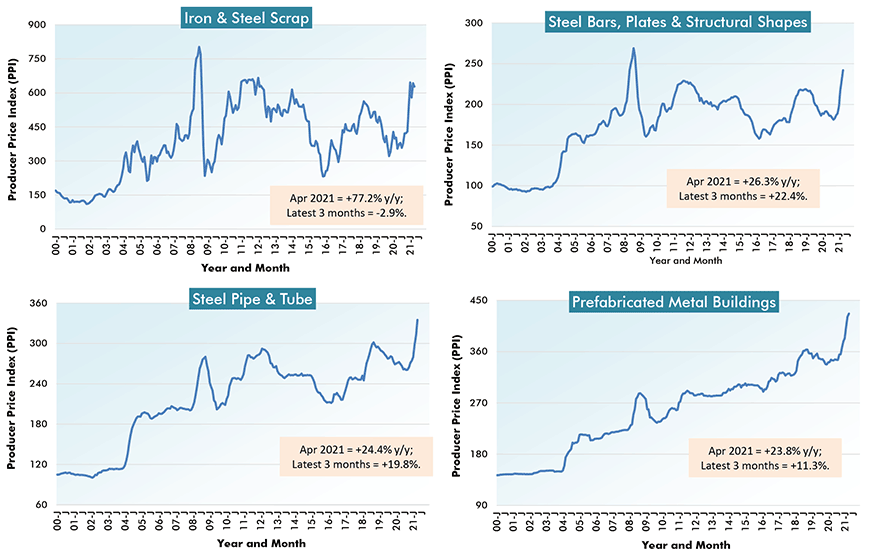
Steel Products
In Graph 2, the ŌĆśsteel bars, plates and structural shapesŌĆÖ price index curve is climbing, although it still has a way to go to match its elevation in 2008. The ŌĆśsteel pipe and tubeŌĆÖ and ŌĆśprefabricated metal buildingŌĆÖ curves, though, are at new heights.
Charts: ║┌┴Ž╔ńConnect.
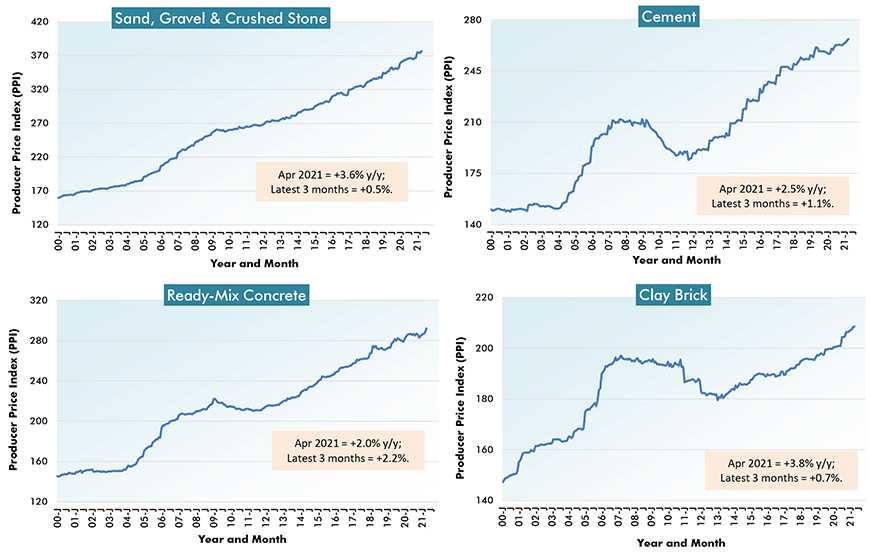
Cement, Concrete & Brick
All the curves in Graph 3 show steadier, less volatile, progressions of price increases over the past decade. Nevertheless, theyŌĆÖre also presently as high as theyŌĆÖve been since the corner was turned on the new century. The highest y/y percentage change appearing in Graph 3ŌĆÖs text boxes is +3.8% for clay brick.
Charts: ║┌┴Ž╔ńConnect.
Base Materials
From Graph 4, iron ore and coal prices are exceptions to the general stepping-up rule these days, as theyŌĆÖre simply moving sideways. Aluminum and copper, though, have definitely jumped on board the ascending price elevator.
Charts: ║┌┴Ž╔ńConnect.
Fiberglass & Energy-Derived Products
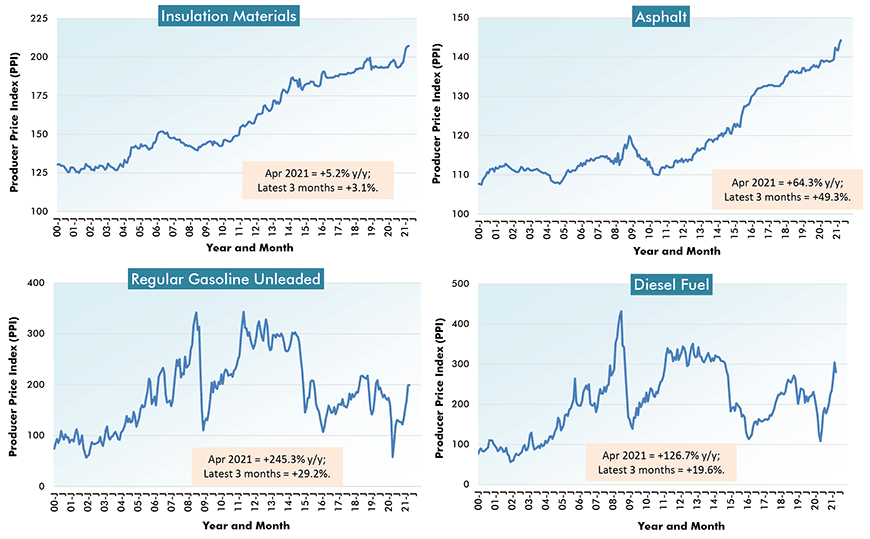
The PPI index (which measures prices as goods exit through factory or refinery ŌĆśgatesŌĆÖ) for regular unleaded gasoline is +245.3% y/y, but that still leaves it well short of previous peaks. By the way, the latest measure of the gasoline sub-index in the CPI series (i.e., ŌĆśat the pumpŌĆÖ) is +49.6% y/y. The diesel fuel PPI has also seen an outsized gain, +126.7% y/y and +19.6% m/m.
The price of asphalt for roads is up by nearly two-thirds (+64.3%) y/y and by one-half (+49.3%) in April alone.
It seems likely that a major infrastructure spending initiative (including road building), as proposed by the new administration in Washington, will be knocked about more than a bit by a seriously escalating cost structure.
Charts: ║┌┴Ž╔ńConnect.
Accessories & Arterial
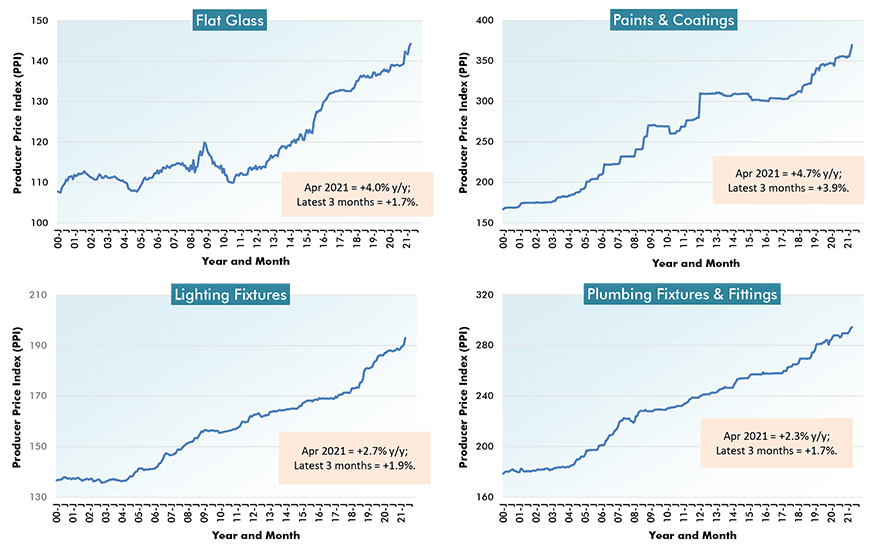
The heftiest year-over-year advance for the four building products set out in Graph 6 is the +4.7% for paints and coatings. Because titanium is a metal thatŌĆÖs stronger and lighter than steel, itŌĆÖs used in the framing of space craft. Because it bonds well with human bones, itŌĆÖs utilized in hip and knee replacements and dental work.
In the construction context, though, titanium is a crucial ingredient in the white pigment of paint. Following a similar pattern to many other metals, the price of titanium is on a rebound.
Charts: ║┌┴Ž╔ńConnect.
% Change in the April 2021 Index from:
| 3 Years | 1 Year | 6 months | 3 months | 1 month | |||||
| Ago | Ago | Ago | Ago | Ago | |||||
| Final Demand/Service/Commodity/Energy/Input: | |||||||||
| Final Demand ║┌┴Ž╔ńion | 10.5% | 2.1% | 2.2% | 1.8% | 1.1% | ||||
| New warehouse building construction | 9.5% | 1.8% | 2.7% | 2.1% | 2.0% | ||||
| New school building construction | 10.7% | 1.1% | 1.4% | 1.3% | 0.9% | ||||
| New office building construction | 11.5% | 3.5% | 3.4% | 2.6% | 0.5% | ||||
| New industrial building construction | 11.8% | 1.6% | 1.1% | 0.9% | 0.7% | ||||
| New health care building construction | 10.6% | 2.6% | 2.5% | 3.2% | 2.5% | ||||
| Architectural & engineering services | 5.3% | 2.5% | 2.5% | 0.8% | 0.2% | ||||
| ║┌┴Ž╔ńion machinery & equipment | 9.5% | 1.4% | 1.4% | 0.3% | 0.1% | ||||
| Asphalt | 30.6% | 64.3% | 67.0% | 49.3% | 16.3% | ||||
| Plastic construction products | 16.7% | 14.2% | 10.0% | 7.8% | 3.3% | ||||
| Softwood lumber | 87.6% | 121.1% | 28.7% | 22.7% | 6.4% | ||||
| Hardwood lumber | 15.2% | 31.6% | 29.2% | 15.7% | 3.5% | ||||
| Millwork | 18.9% | 14.0% | 6.9% | 3.9% | 1.8% | ||||
| Plywood | 45.5% | 70.4% | 27.6% | 30.4% | 10.0% | ||||
| Particle board & oriented strandboard (OSB) | 77.0% | 105.9% | 23.0% | 24.9% | 9.8% | ||||
| Gypsum | 2.8% | 12.1% | 13.0% | 5.7% | 3.9% | ||||
| Insulation materials | 7.5% | 5.2% | 6.8% | 3.1% | 0.1% | ||||
| ║┌┴Ž╔ńion sand, gravel & crushed stone | 13.0% | 3.6% | 3.2% | 0.5% | 0.7% | ||||
| Cement | 6.3% | 2.5% | 1.5% | 1.1% | 0.4% | ||||
| Ready-mix concrete | 7.0% | 2.0% | 2.1% | 2.2% | 1.5% | ||||
| Precast concrete products | 14.1% | 5.3% | 4.5% | 2.8% | 1.6% | ||||
| Prestressed concrete products | 8.3% | 0.2% | 3.0% | 1.9% | 1.3% | ||||
| Brick (clay) | 6.5% | 3.8% | 1.1% | 0.7% | 0.1% | ||||
| Coal | -3.2% | 1.0% | 1.8% | 1.5% | 1.9% | ||||
| Iron ore | 15.4% | 6.5% | 3.4% | 0.6% | 0.6% | ||||
| Iron & steel scrap | 11.5% | 77.2% | 48.5% | -2.9% | -2.4% | ||||
| Steel bars, plates & structural shapes | 22.4% | 26.3% | 32.3% | 22.4% | 5.1% | ||||
| Steel pipe & tube | 23.8% | 24.4% | 26.6% | 19.8% | 7.4% | ||||
| Fabricated structural metal products | 15.9% | 12.7% | 12.9% | 9.7% | 2.8% | ||||
| Prefabricated Metal Buildings | 22.4% | 23.8% | 20.1% | 11.3% | 1.3% | ||||
| Aluminum mill shapes | 6.6% | 20.5% | 17.9% | 9.9% | 7.5% | ||||
| Flat glass | 5.8% | 4.0% | 3.7% | 1.7% | 0.6% | ||||
| Paints, architectural coatings | 16.2% | 4.7% | 4.0% | 3.9% | 2.1% | ||||
| Lighting fixtures | 11.4% | 2.7% | 2.2% | 1.9% | 1.4% | ||||
| Plumbing fixtures & fittings | 9.2% | 2.3% | 1.7% | 1.7% | 0.4% | ||||
| Elevators & escalators | 8.4% | 1.7% | 1.6% | 1.6% | 0.5% | ||||
| Heating equipment | 16.1% | 6.6% | 6.4% | 6.1% | 3.8% | ||||
| Air conditioning equipment | 13.1% | 5.1% | 4.7% | 2.9% | 0.8% | ||||
| Copper wire & cable | 18.5% | 30.9% | 17.8% | 8.6% | 2.0% | ||||
| Regular gasoline unleaded | 0.7% | 245.3% | 57.5% | 29.2% | 0.4% | ||||
| Diesel Fuel | 20.9% | 126.7% | 49.6% | 19.6% | -8.0% | ||||
| Inputs to new construction | 17.6% | 18.8% | 9.7% | 7.3% | 2.0% | ||||
| Inputs to new residential construction | 19.2% | 19.8% | 9.0% | 8.4% | 2.7% | ||||
| Inputs to new non-res construction | 15.8% | 17.6% | 10.6% | 6.2% | 1.5% | ||||
| Inputs to commercial construction | 15.2% | 16.0% | 10.4% | 5.9% | 1.6% | ||||
| Inputs to healthcare structures | 16.2% | 16.7% | 10.0% | 6.0% | 1.8% | ||||
| Inputs to industrial structures | 16.2% | 14.9% | 9.9% | 5.2% | 1.5% | ||||
| Inputs to highways & streets | 12.1% | 16.2% | 10.3% | 5.4% | 1.0% | ||||
| Inputs to power & communication structures | 14.6% | 18.3% | 11.3% | 6.7% | 1.7% | ||||
| Inputs to educational & vocational structures | 17.7% | 17.4% | 10.1% | 6.4% | 2.0% | ||||
| ║┌┴Ž╔ńion materials (PPI ‘Special Index’) | 24.8% | 23.8% | 17.7% | 13.8% | 5.2% |
The ‘service’, ‘commodity’ and ‘energy’ indices (in the middle section of the table) are based on ‘factory-gate’ sales prices.
The ‘input’ indices (at bottom) reflect costs faced by contractors. They exclude capital investment (i.e., machinery & equipment), labor & imports.
The ‘input’ indices are built up from the ‘service’ (design, legal, transport & warehousing, etc.) ‘commodity’ and ‘energy’ indices.
Table: ║┌┴Ž╔ńConnect.
Please click on the following link to download the PDF version of this article:
Alex Carrick is Chief Economist for ║┌┴Ž╔ńConnect. He has delivered presentations throughout North America on the U.S., Canadian and world construction outlooks. Mr. Carrick has been with the company since 1985. Links to his numerous articles are featured on Twitter , which has 50,000 followers.


Recent Comments
comments for this post are closed