
The headlines are no longer screaming about steeply climbing lumber prices. The ultra-sharp gains are over and a pullback phase has settled in.

A moderation in price was expected due to housing starts leveling off and home renovation projects being put on the back burner, as the leisure-time days of summer are replaced by the more frenetically paced days of fall.
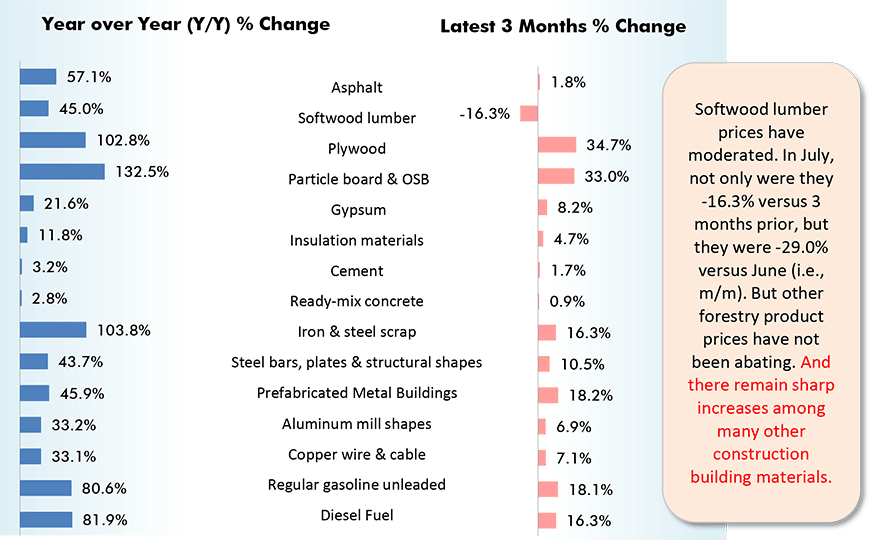
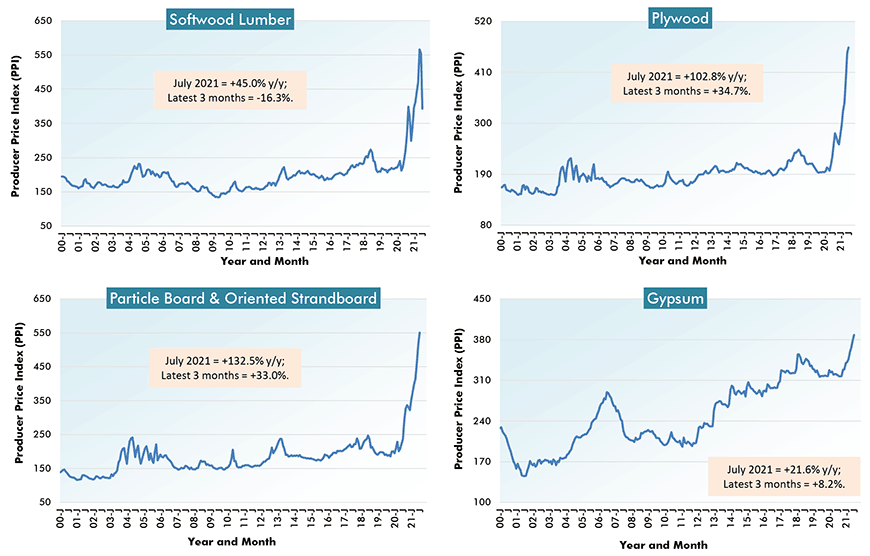
July’s Producer Price Index (PPI) for softwood lumber, shown in Table 1, was -16.3% compared with three months ago in April. The latest month-to-month price change was -29.0%.
As Table 1 and Graph 1 set out, however, the price advances for other forestry products, and for a multitude of other inputs used in the building process, have not let up much.
Prices for plywood and particle board/OSB are both higher by double year over year and by one-third over the latest three months (which will be referred to as quarter over quarter or q/q). Month to month in July, plywood was +3% and particle board/OSB, +7%.
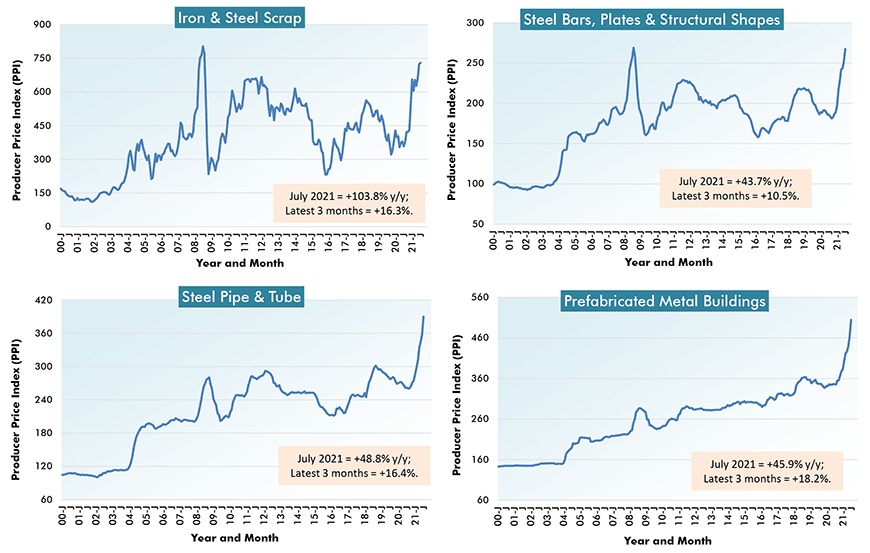
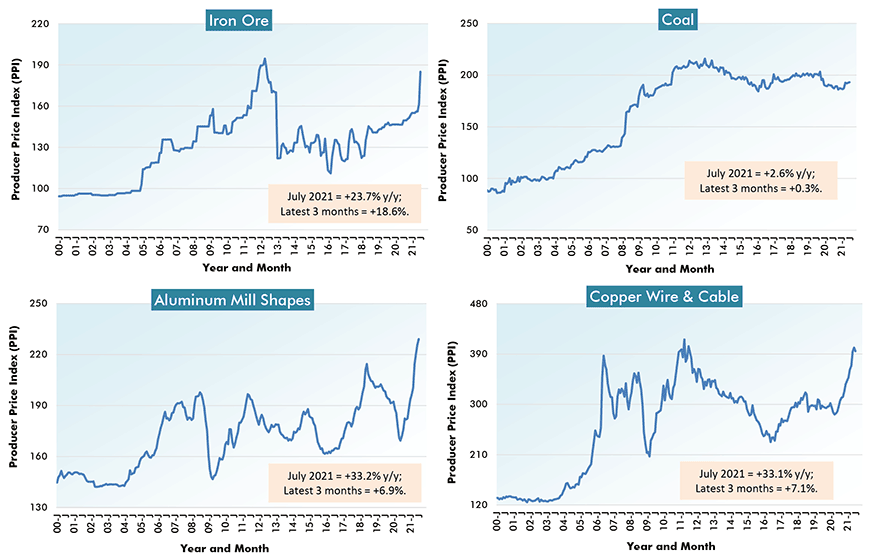
Steel bars, plates and structural shapes in July were +43.7% year over year, +10.5% over the latest three months and +6.0% month to month. Iron and steel scrap used in electric-arc steelmaking furnaces was +103.8% y/y, +16.3% q/q and +0.8% m/m.
Interestingly, the Consumer Price Index (CPI) for used cars and trucks, the eventual primary source of steel scrap, was also higher by an extraordinary amount in July, +41.7%.
The ‘steel pipe and tube’ PPI in July was +48.8% y/y, +16.4% q/q and +9.0% m/m.
July’s aluminum mill shapes PPI was +33.2% y/y, +6.9% q/q and +1.5% m/m.
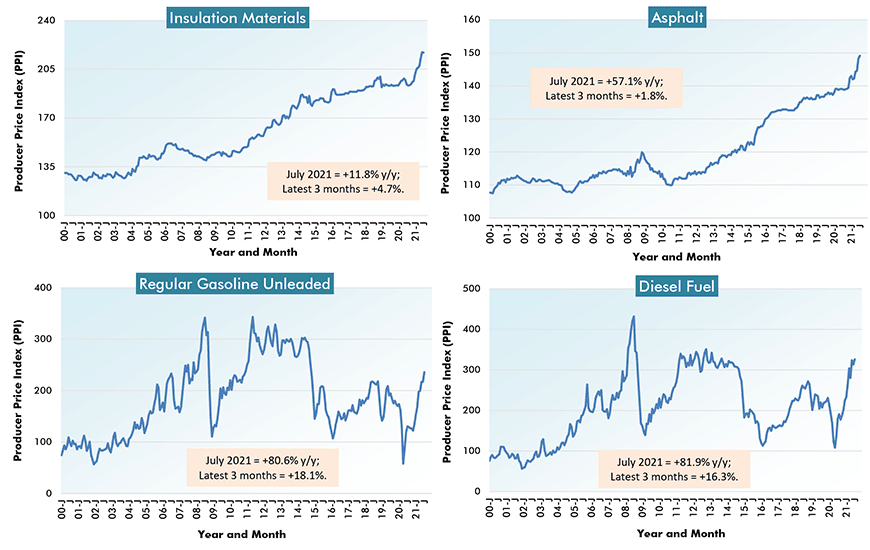
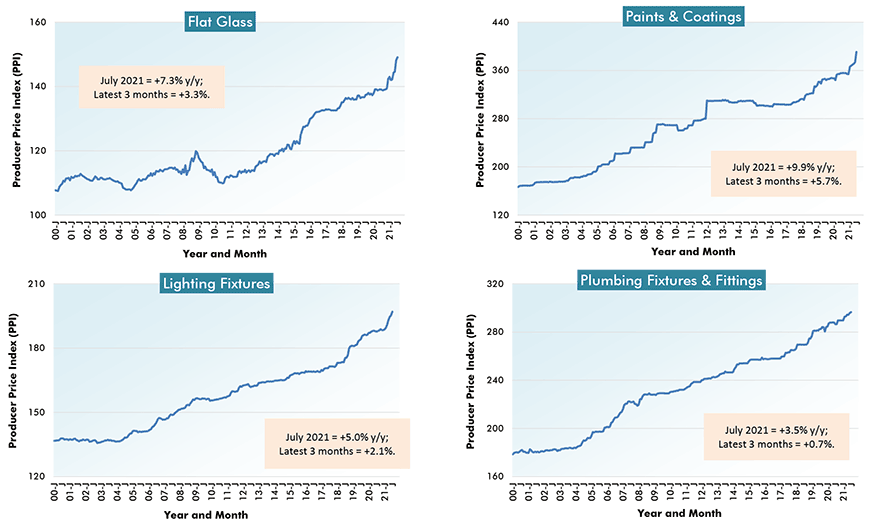
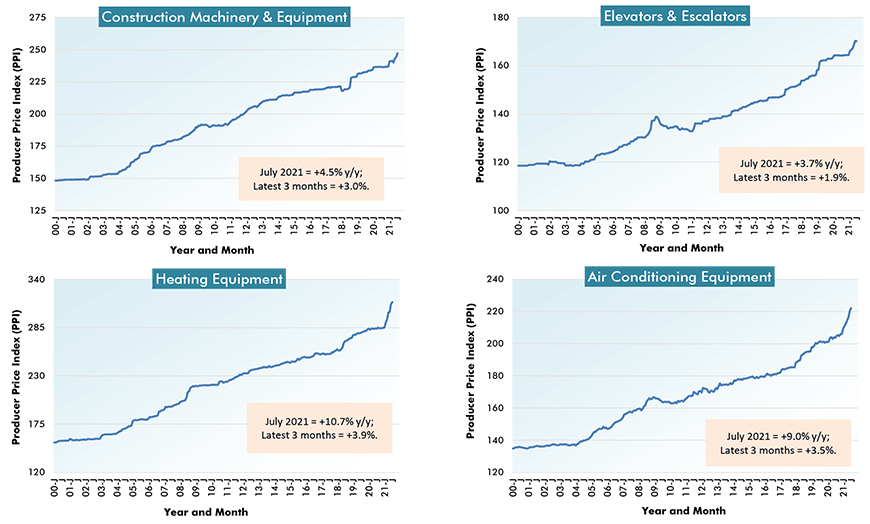
Some of the other dramatic year over year PPI sub-category increases in July were: gasoline and diesel fuel, a little more than +80%; gypsum, +22%; insulation materials, +12%; air conditioning and heating equipment, about +10%; paints and architectural coatings, also +10%; and flat glass, +9.5%.
The only PPI sub-index registering a decline beyond just -0.1% month to month in July, other than softwood lumber’s -29.0%, was copper wire and cable, at -1.6%. On a year-over-year basis, though, ‘copper wire and cable’ was ahead by one-third, +33.1%.
The bottom line is that bid prices are still failing, in epic fashion, to keep up with material cost increases. This is most clearly spelled out in Graph 2, where two PPI measures of material prices are currently ranging from plus one-quarter to plus one-third (+25.4% to +33.1%), while the y/y ‘bid price index’ is only +4.5%.
The historical performances of the PPI series for 28 building inputs are set out in seven cluster charts (of four graphs each) appearing below.
At the end of this article is Table 2 with Canadian building product prices. The most stunning gains are pointed out with red arrows. The Canadian results generally mirror what has been transpiring in the U.S.
The major exception is that the Canadian data only runs through June, a month behind the U.S. figures. Therefore, the recent pullback in lumber prices has not yet been captured.
From Producer Price Index (PPI) Series – July 2021
Charts: ������Connect.
% Change in the July 2021 Index from:
| 3 Years | 1 Year | 6 months | 3 months | 1 month | |||||
| Ago | Ago | Ago | Ago | Ago | |||||
| Final Demand/Service/Commodity/Energy/Input: | |||||||||
| Final Demand ������ion | 12.8% | 4.5% | 4.6% | 2.8% | 1.5% | ||||
| New warehouse building construction | 13.5% | 6.5% | 6.3% | 4.2% | 2.6% | ||||
| New school building construction | 13.1% | 3.3% | 3.8% | 2.5% | 2.4% | ||||
| New office building construction | 13.5% | 5.9% | 5.3% | 2.8% | 1.3% | ||||
| New industrial building construction | 14.2% | 3.9% | 3.9% | 3.0% | 2.6% | ||||
| New health care building construction | 11.2% | 3.2% | 4.1% | 1.4% | -0.2% | ||||
| Architectural & engineering services | 5.2% | 3.3% | 0.5% | 0.6% | 0.2% | ||||
| ������ion machinery & equipment | 12.1% | 4.5% | 2.7% | 3.0% | 1.2% | ||||
| Asphalt | 0.7% | 57.1% | 52.1% | 1.8% | 6.5% | ||||
| Plastic construction products | 29.3% | 26.7% | 20.1% | 10.8% | 4.5% | ||||
| Softwood lumber | 47.9% | 45.0% | -1.0% | -16.3% | -29.0% | ||||
| Hardwood lumber | 27.4% | 45.8% | 27.8% | 10.4% | 6.3% | ||||
| Millwork | 25.9% | 21.8% | 13.4% | 8.0% | 0.1% | ||||
| Plywood | 93.7% | 102.8% | 67.7% | 34.7% | 2.6% | ||||
| Particle board & oriented strandboard (OSB) | 132.0% | 132.5% | 56.1% | 33.0% | 6.8% | ||||
| Gypsum | 13.3% | 21.6% | 14.3% | 8.2% | 2.6% | ||||
| Insulation materials | 12.4% | 11.8% | 7.7% | 4.7% | -0.1% | ||||
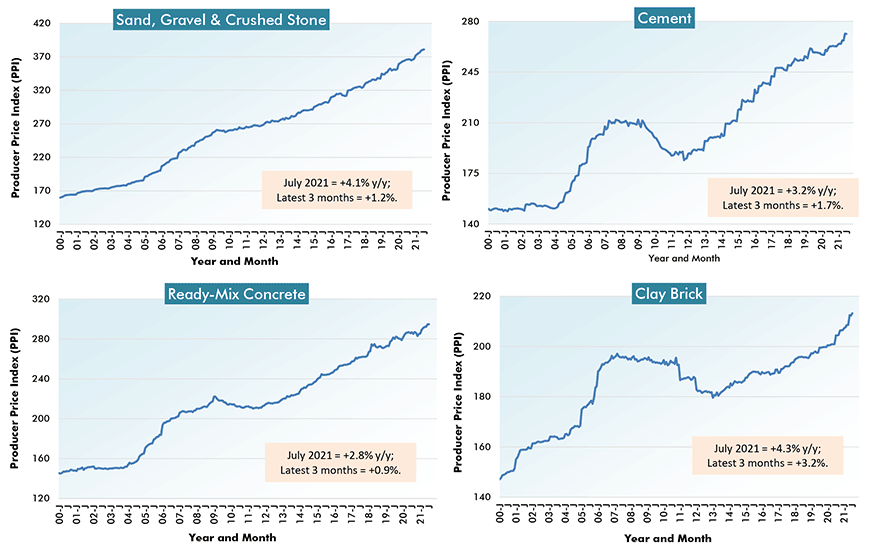
| ������ion sand, gravel & crushed stone | 13.4% | 4.1% | 2.5% | 1.2% | 0.2% | ||||
| Cement | 7.1% | 3.2% | 2.8% | 1.7% | -0.1% | ||||
| Ready-mix concrete | 8.5% | 2.8% | 3.3% | 0.9% | 0.0% | ||||
| Precast concrete products | 16.9% | 9.2% | 5.8% | 3.5% | 1.3% | ||||
| Prestressed concrete products | 12.7% | 9.3% | 9.8% | 7.8% | -0.1% | ||||
| Brick (clay) | 8.9% | 4.3% | 2.8% | 2.2% | 0.4% | ||||
| Coal | -3.3% | 2.6% | 3.3% | 0.3% | 0.3% | ||||
| Iron ore | 28.6% | 23.7% | 19.4% | 18.6% | 14.6% | ||||
| Iron & steel scrap | 35.4% | 103.8% | 11.3% | 16.3% | 0.8% | ||||
| Steel bars, plates & structural shapes | 26.1% | 43.7% | 35.3% | 10.5% | 6.0% | ||||
| Steel pipe & tube | 33.7% | 48.8% | 36.4% | 16.4% | 9.0% | ||||
| Fabricated structural metal products | 29.2% | 28.8% | 24.7% | 14.0% | 2.8% | ||||
| Prefabricated Metal Buildings | 39.6% | 45.9% | 31.7% | 18.2% | 8.4% | ||||
| Aluminum mill shapes | 9.9% | 33.2% | 18.4% | 6.9% | 1.5% | ||||
| Flat glass | 9.5% | 7.3% | 4.3% | 3.3% | 0.6% | ||||
| Paints, architectural coatings | 21.6% | 9.9% | 10.4% | 5.7% | 4.5% | ||||
| Lighting fixtures | 12.3% | 5.0% | 4.4% | 2.1% | 0.9% | ||||
| Plumbing fixtures & fittings | 10.0% | 3.5% | 2.4% | 0.7% | 0.2% | ||||
| Elevators & escalators | 9.5% | 3.7% | 3.5% | 1.9% | -0.1% | ||||
| Heating equipment | 16.5% | 10.7% | 10.2% | 3.9% | 0.7% | ||||
| Air conditioning equipment | 14.5% | 9.0% | 6.0% | 3.5% | 0.8% | ||||
| Copper wire & cable | 23.0% | 33.1% | 15.4% | 7.1% | -1.6% | ||||
| Regular gasoline unleaded | 9.4% | 80.6% | 53.0% | 18.1% | 8.5% | ||||
| Diesel Fuel | 26.9% | 81.9% | 40.0% | 16.3% | 4.0% | ||||
| Inputs to new construction | 25.7% | 25.4% | 15.6% | 9.2% | 0.9% | ||||
| Inputs to new residential construction | 28.7% | 27.8% | 16.9% | 10.1% | 0.8% | ||||
| Inputs to new non-res construction | 22.8% | 23.1% | 14.3% | 8.4% | 1.0% | ||||
| Inputs to commercial construction | 22.1% | 22.3% | 14.0% | 8.3% | 1.1% | ||||
| Inputs to healthcare structures | 22.8% | 22.3% | 13.8% | 7.9% | 0.8% | ||||
| Inputs to industrial structures | 22.8% | 20.4% | 12.5% | 7.5% | 1.5% | ||||
| Inputs to highways & streets | 18.3% | 20.9% | 13.6% | 8.4% | 1.1% | ||||
| Inputs to power & communication structures | 21.7% | 23.8% | 15.1% | 8.7% | 1.0% | ||||
| Inputs to educational & vocational structures | 24.2% | 22.9% | 13.8% | 7.7% | 0.5% | ||||
| ������ion materials (PPI ‘Special Index’) | 31.6% | 33.1% | 23.0% | 8.8% | 0.2% |
The ‘service’, ‘commodity’ and ‘energy’ indices (in the middle section of the table) are based on ‘factory-gate’ sales prices.
The ‘input’ indices (at bottom) reflect costs faced by contractors. They exclude capital investment (i.e., machinery & equipment), labor & imports.
The ‘input’ indices are built up from the ‘service’ (design, legal, transport & warehousing, etc.) ‘commodity’ and ‘energy’ indices.
Table: ������Connect.
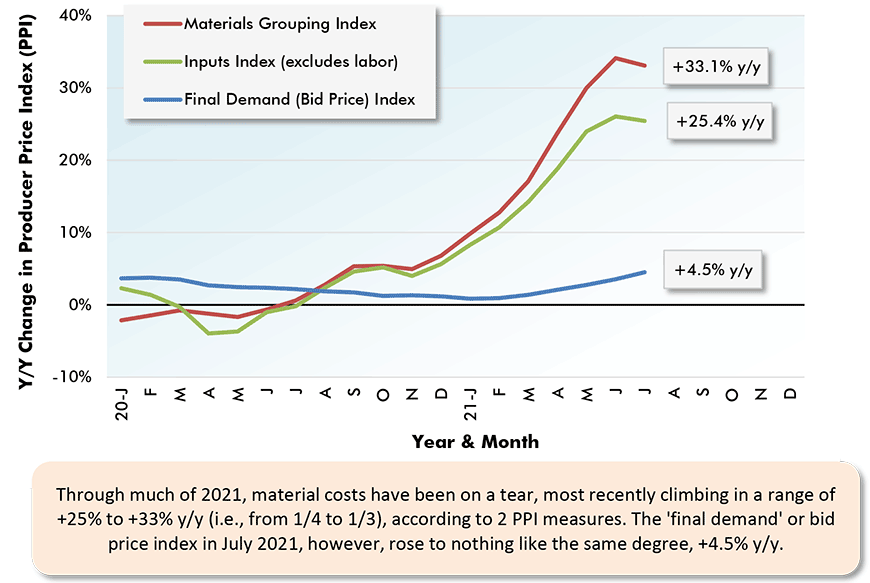
Chart: ������Connect.
Chart: ������Connect.
Charts: ������Connect.
Charts: ������Connect.
Charts: ������Connect.
Charts: ������Connect.
Charts: ������Connect.
Charts: ������Connect.
Charts: ������Connect.
Based on Industrial Product Price Index (IPPI) Series from Statistics Canada
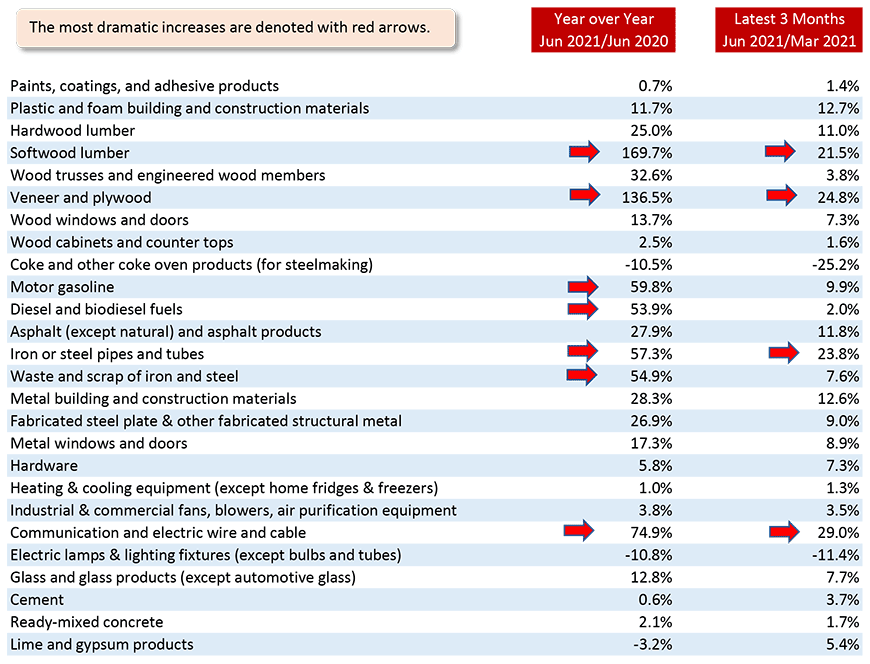
Table: ������Connect.
Alex Carrick is Chief Economist for ������Connect. He has delivered presentations throughout North America on the U.S., Canadian and world construction outlooks. Mr. Carrick has been with the company since 1985. Links to his numerous articles are featured on Twitter , which has 50,000 followers.
Please click on the following link to download the PDF version of this article:


Recent Comments
comments for this post are closed