As a companion piece to ������Connect’s recent article on movements in U.S. construction material costs, today’s story will look at what’s been happening in Canada. Similar to America, Canada has seen moderation in prices for some individual construction inputs. On the whole, though, the Canadian easing has perhaps not been as extensive. Table 1 seems to support that assertion.
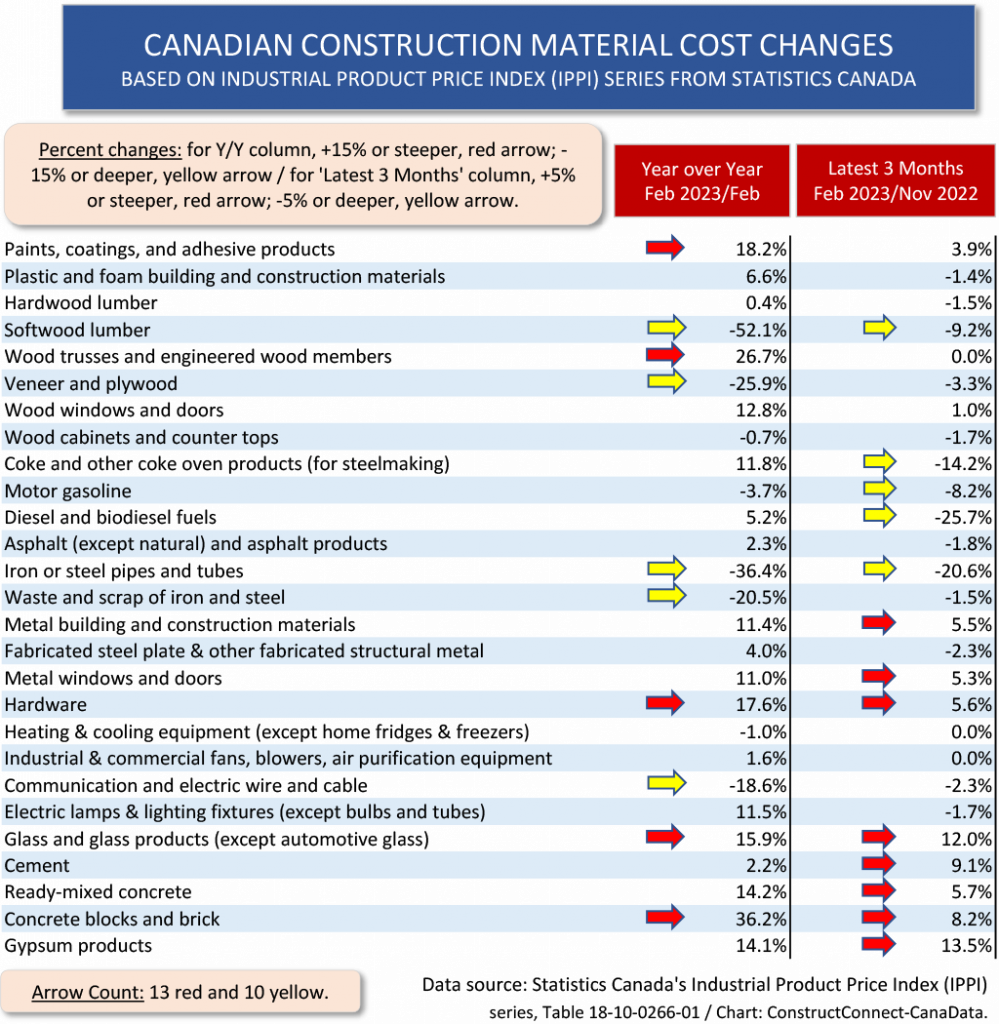
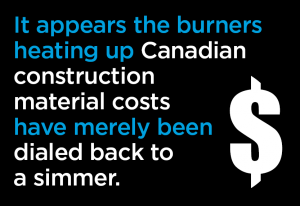 Table 1 sets out year-over-year and latest-three-months’ price changes for 27 construction material inputs. By the way, the source for price changes in Canada is the Industrial Product Price Index (IPPI) data set compiled by Statistics Canada. The IPPI series is the equivalent of the Producer Price Index (PPI) series produced by the Bureau of Labor Statistics (BLS) in the U.S.
The colored arrows in Table 1 draw attention to dramatic price movements. For y/y results, red arrows point to increases of +15.0% or more; yellow arrows, to decreases of -15.0% or more. For latest three months’ results, red arrows point to price climbs of +5.0% or more; yellow arrows, to retreats of -5% or more.
In total, there are 23 arrows in Table 1, 13 of them red and 10 of them yellow. The overall weighting leans more towards increases.
For the y/y results alone, there is an even split, five red and five yellow arrows. For the latest-three-months’ results, there are eight red to five yellow arrows.
Therefore, particularly noteworthy, is the fact that the latest three months have not offered the pricing relief that might well have been expected, given the Bank of Canada’s efforts to slow the economy through interest rate tightening. It appears the burners heating up Canadian construction material costs have merely been dialed back to a simmer.
Most of the separate graphs in the Canadian cluster charts show similar patterns, for the same time frames, as the previously uploaded U.S. cluster charts. The phrase ‘for the same time frames’ is stressed because the Canadian graphs present a shorter history of data, 2010 to the present, than the U.S. ones, 2000 to the present.
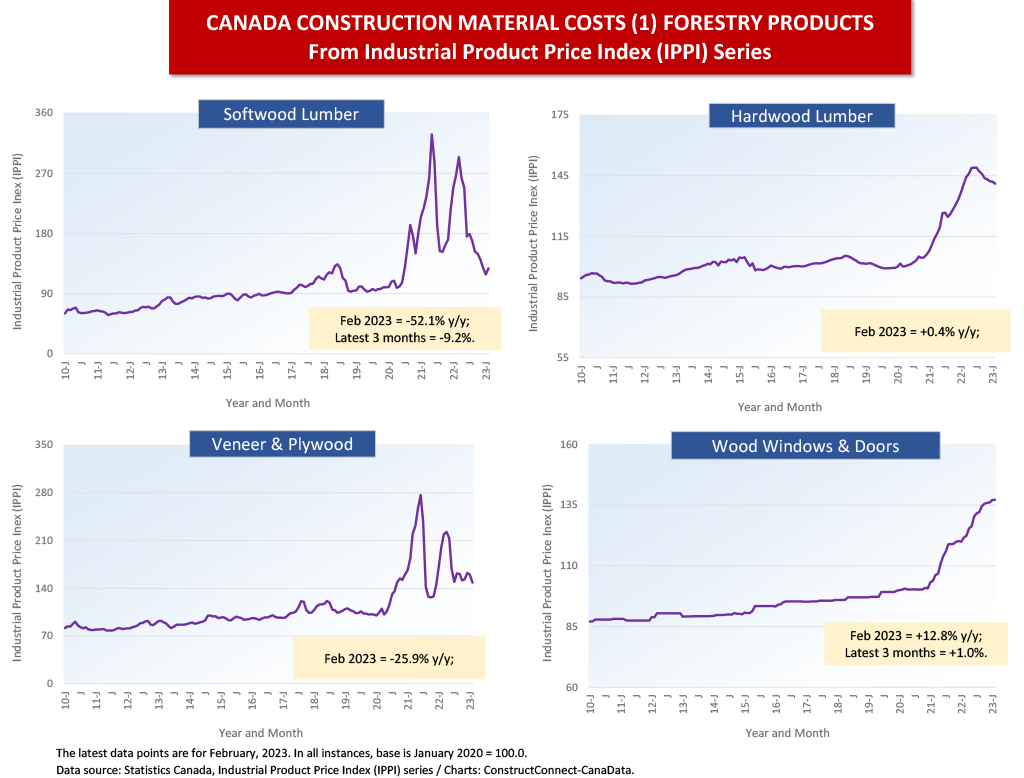
Forestry product prices in both countries usually take nearly the same up and down routes. The reason is because lumber demand is dependent on new home starts jointly south and north of the border. U.S. homebuilding is a prime market for Canadian sawmills, despite the persistent efforts made by U.S. producers to block imports, now that the Softwood Lumber Agreement (SLA) has expired.
In both countries, the price of softwood lumber is in decline coincident with weaker levels of housing starts. The Canadian graphs show, however, that hardwood lumber and more-finished forestry products (e.g., wood windows and doors) are seeing limited to no price relief.
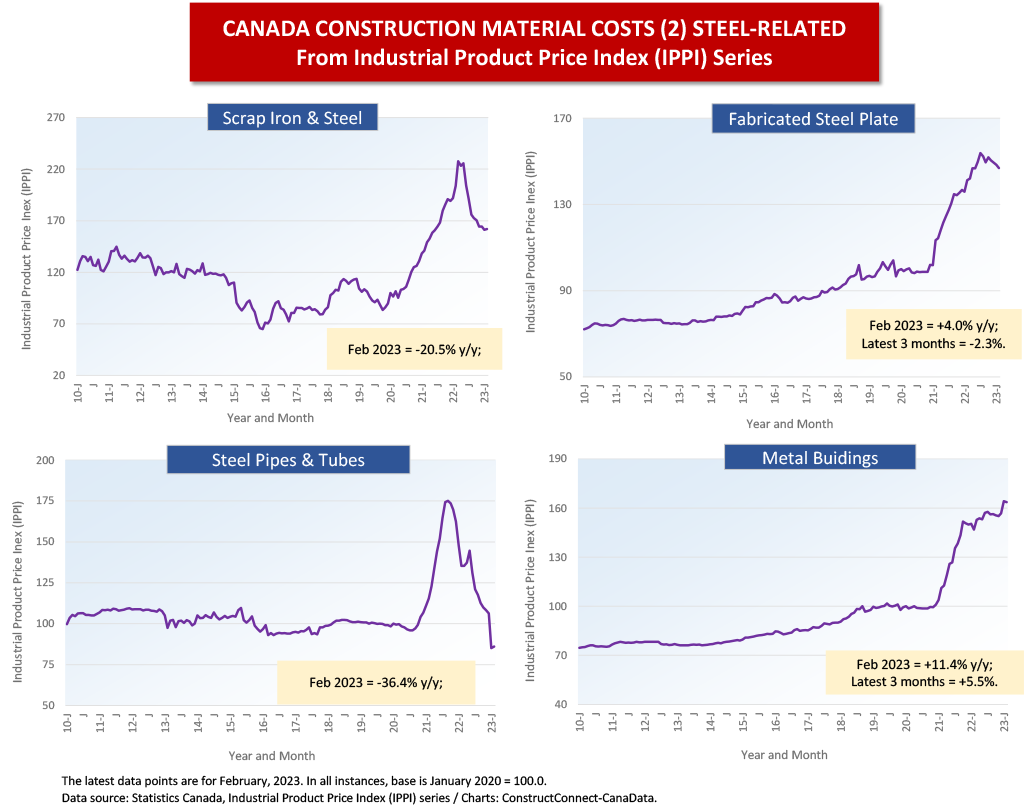
Canadian steel prices are off their peaks. This is especially true for the ‘pipes and tubes’ category, which is -36.4% y/y. In the U.S., the ‘steel pipe and tube’ PPI is down as well, but to less than half that extent, -16.0%.
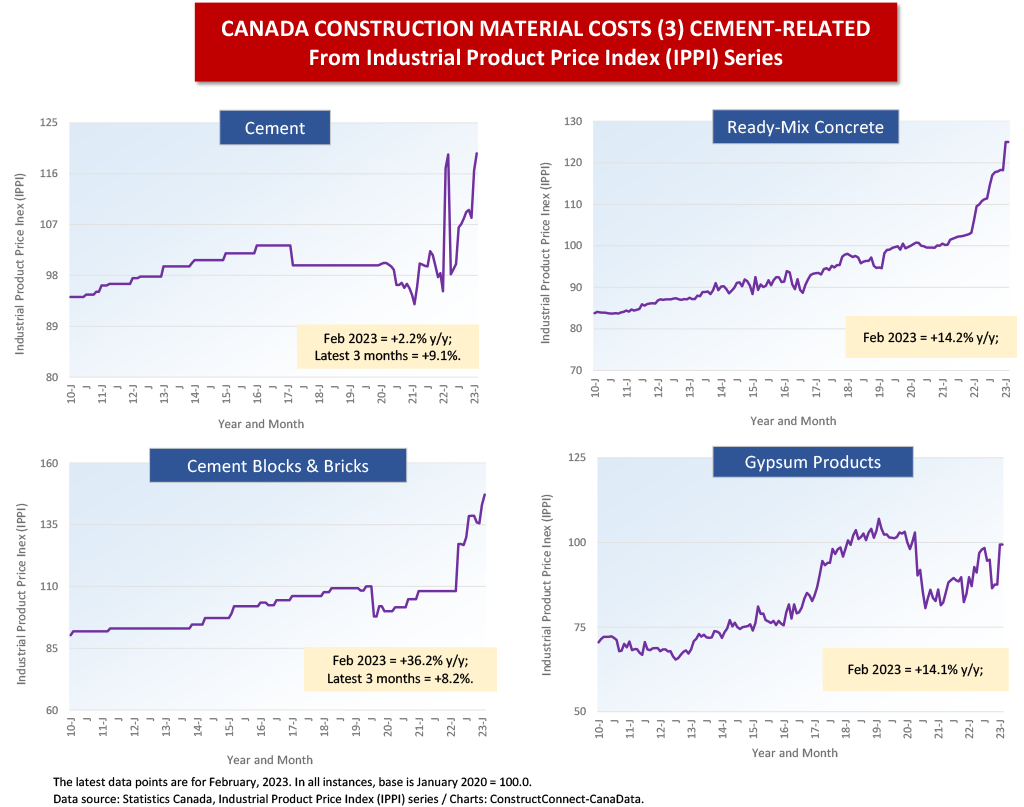
Canadian prices for cement, ready-mix concrete and blocks and bricks are all looking skyward. In the U.S., the price of cement is +15.0% y/y. By comparison, Canada looks great, +2.2%; but that low increase is an anomaly of timing. If February 2023 is compared not with February of last year, but rather with January 2022, (i.e., one month earlier), the increase is +25.6%.
Also notice from Cluster Chart 3 that the price of cement in Canada has really bounced around in the past several years. That wasn’t typical during the long lead-in period prior to the pandemic. The pattern during much of the period before the pandemic was for the price of cement to be adjusted once per year and for the change to be relatively minor.
The y/y increase in the price of ready-mix concrete is about the same in both countries, +12.3% in the U.S. and +14.2% in Canada.
Gypsum is the one product where the pricing paths taken in each country are significantly different. In the U.S., there’s been continuous uplift; in Canada, the IPPI for gypsum has become somewhat sedate, although it suddenly shot up in the latest three months, +13.5%. But that still doesn’t quite take it to its previous heights.
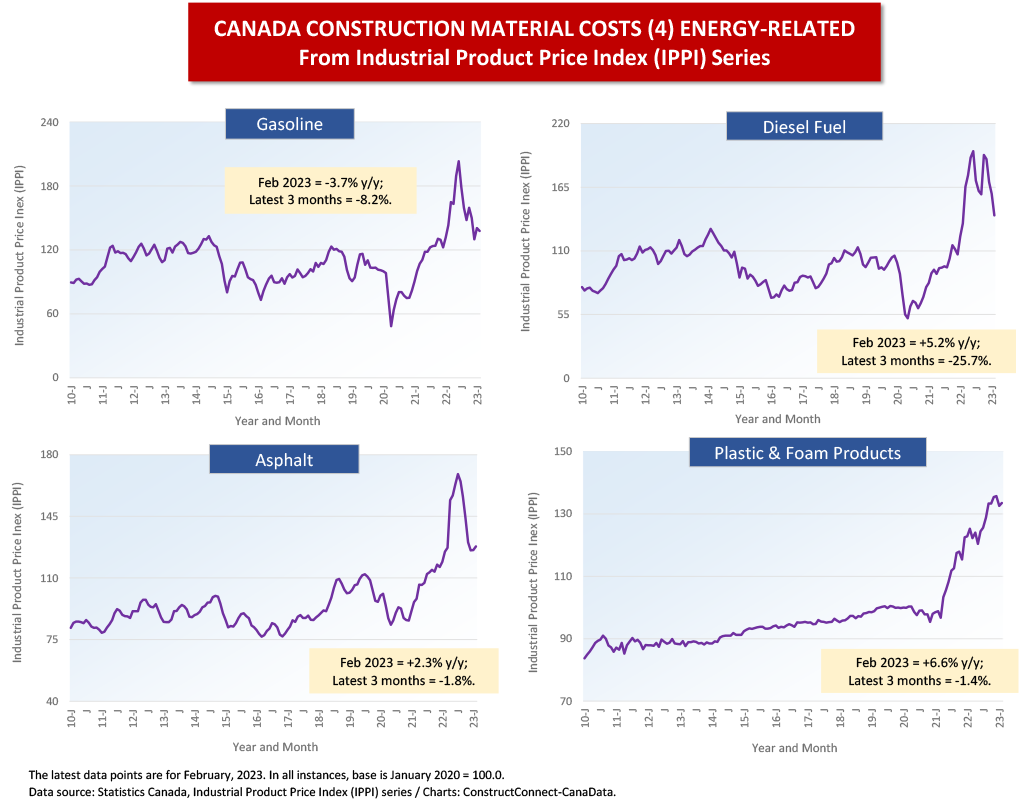
The recent easing in prices for energy-related products (Cluster Chart 4), ̶ i.e., for asphalt, diesel fuel, and gasoline, ̶ is apparent in Canada as it is in the earlier-presented U.S. graphs. Insulation materials and foam products, though, are continuing to trend significantly upwards.
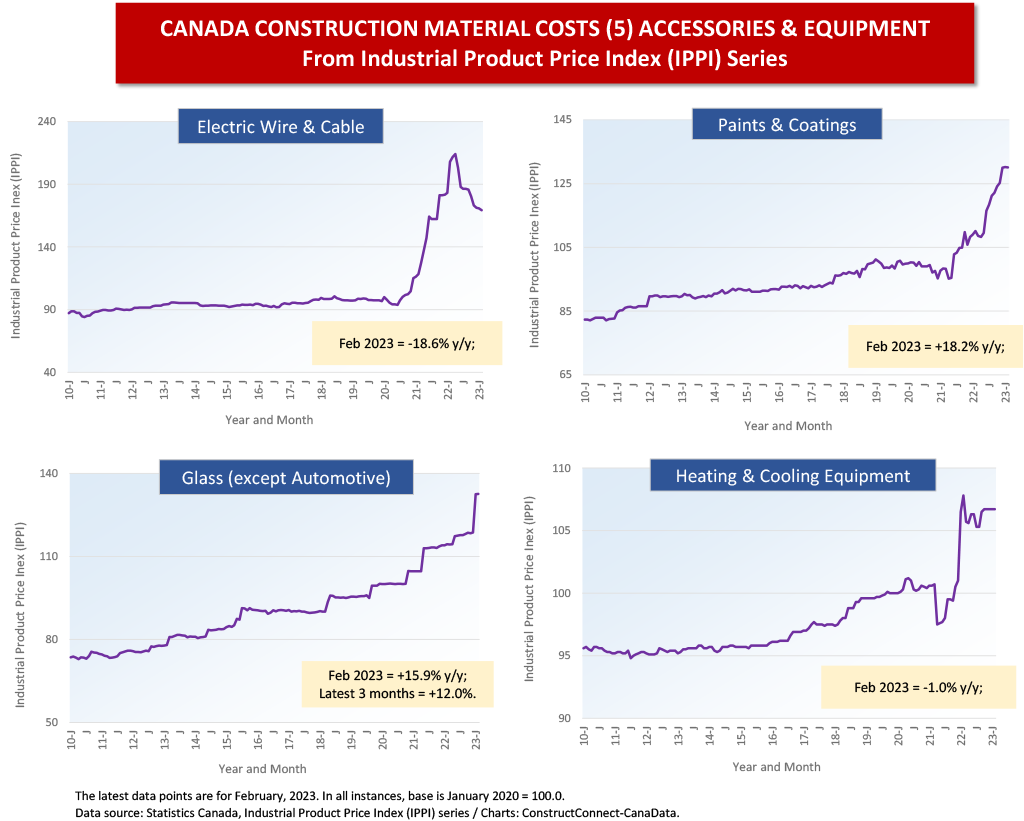
In a fashion similar to what has occurred in the U.S., ‘glass’ and ‘paints and coatings’ are two construction material categories that in Canada have recently embraced more pricing audacity than in the past. In Canada, the former is +15.9% y/y (vs +11.7% in the U.S.), while the latter is +18.2% y/y (vs +15.2% in the U.S.).
Finally, heating and cooling equipment in Canada may be -1.0% y/y, but if February 2023’s relevant IPPI is positioned next to its level from 16 months ago, rather than 12 months ago, the change is +7.3%, which is not far off the U.S. ‘heating equipment’ PPI figure of +8.1% y/y and the U.S. ‘cooling equipment’ PPI figure of +10.7% y/y.
Table 1
Cluster Chart 1 – Forestry Products
Cluster Chart 2 – Steel-related Products
Cluster Chart 3 – Cement-related Products
Cluster Chart 4 – Energy-related Products
Cluster Chart 5 – Accessories & Equipment
Alex Carrick is Chief Economist for ������Connect. He has delivered presentations throughout North America on the U.S., Canadian and world construction outlooks. Mr. Carrick has been with the company since 1985. Links to his numerous articles are featured on Twitter��, which has 50,000 followers.


Recent Comments
comments for this post are closed