
August was a good month for jobs creation in CanadaÔÇÖs construction sector, according to the latest from Statistics Canada. The month-to-month hiring figure of +34,000 was the second best in a little more than three years, beaten only by February 2022 at +45,000.
The not seasonally adjusted (NSA) unemployment rate in Canadian construction in the latest month was a miniscule 3.4%, with several provinces recording even lower NSA U rates: Nova Scotia (2.9%); Quebec (1.9%); and British Columbia (2.6%).
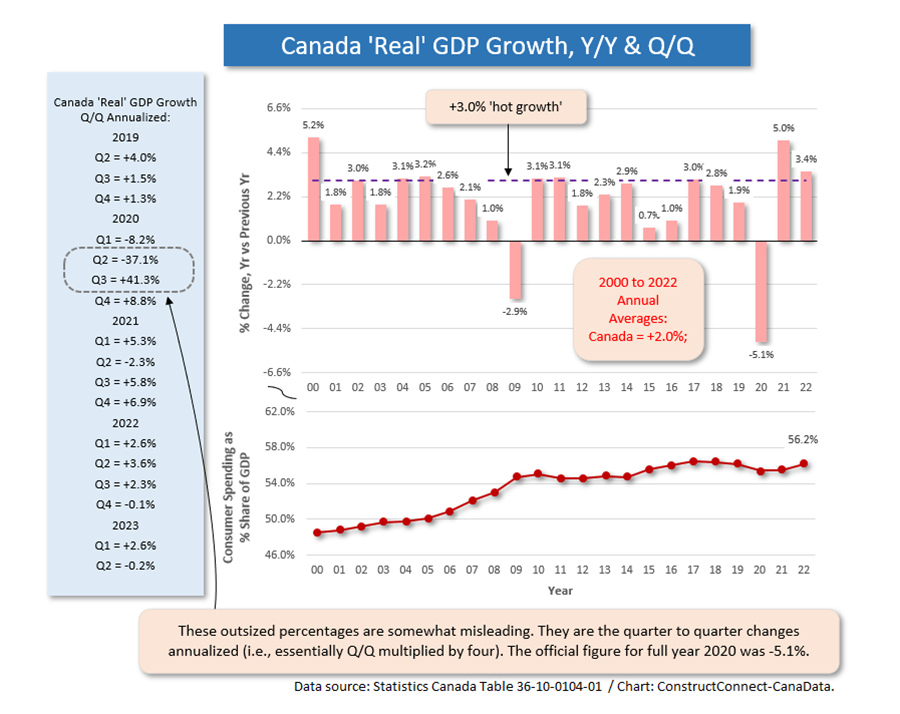
 The Bank of Canada is slowing growth of the overall economy through high interest rates. ItÔÇÖs achieving a version of ÔÇÿsuccessÔÇÖ (i.e., others would argue this is not such a good thing), as witness the -0.2% change in ÔÇÿrealÔÇÖ (i.e., inflation-adjusted) gross domestic product (GDP), quarter to quarter annualized, in Q2.
But there has been little reining in of Canadian employment growth. The total number of jobs in Canada in August rose by +40,000. The average monthly increase through the first eight months of the current year has also been +40,000, beating last yearÔÇÖs January-August monthly average of +29,000 by more than a third.
The NSA U rate for CanadaÔÇÖs economy as a whole, calculated according to the same methodology as is used by the U.S. Bureau of Labor Statistics (BLS), is now 4.6%, which is less than a percentage point above AmericaÔÇÖs comparable figure of 3.9%.
Capital spending being undertaken by the U.S. manufacturing sector is skyrocketing (EV battery plants, computer chipmaking plants, etc.), meaning an eventual bonanza for jobs creation in the sector, although automation and robotics will be offsetting factors.
In Canada, a careful eye will need to be kept on whether manufacturing activity is showing the same degree of improvement as south of the border. So far, thereÔÇÖs been a pronounced lag. There have been some mega industrial project initiations in Canada, but not to a commensurate degree as in the U.S. AugustÔÇÖs change in Canadian manufacturing employment of -30,000 jobs was not what one wants to see.
The average monthly change in Canadian manufacturing employment year to date has been just +3,000 jobs. Last year, through August, it was +1,000. In baseball terms, those numbers are bunts or grounders; theyÔÇÖre sure not home runs.
With respect to their workplaces, both Canada and the U.S. are witnessing historically big jumps in compensation rates. In Canada, ÔÇÿall jobsÔÇÖ earnings in August were +4.9% y/y hourly and an identical +4.9% y/y weekly. In the U.S., the y/y paycheck advances for ÔÇÿall jobsÔÇÖ in the latest month were +4.3% hourly and +4.0% weekly.
But not all workers are experiencing the same earnings euphoria. Table 1 records that non-union workers, with a large ÔÇÿgigÔÇÖ component and a great deal more flexibility in their post-pandemic job hunting, are realizing y/y wage increases of +6.0% hourly and weekly. Union workers, locked into previously-signed agreements, are stuck with increases across the board of +2.5% y/y.
This is a formula for labor unrest. Dissatisfaction has already reared up among airline pilots, courier drivers, and entertainment screenwriters. In its latest iteration, thereÔÇÖs the militancy being expressed by organized U.S. and Canadian auto sector workers.
Graph 1
Graph 2
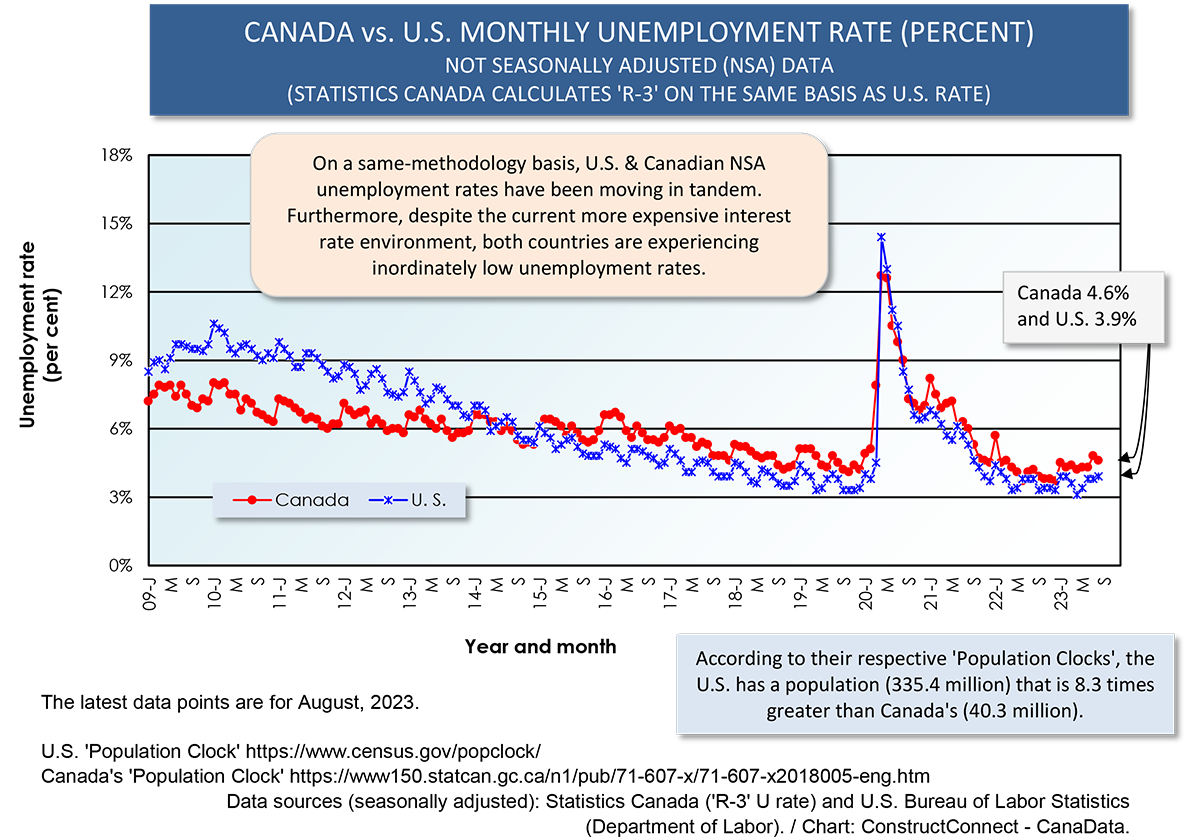
Table 1
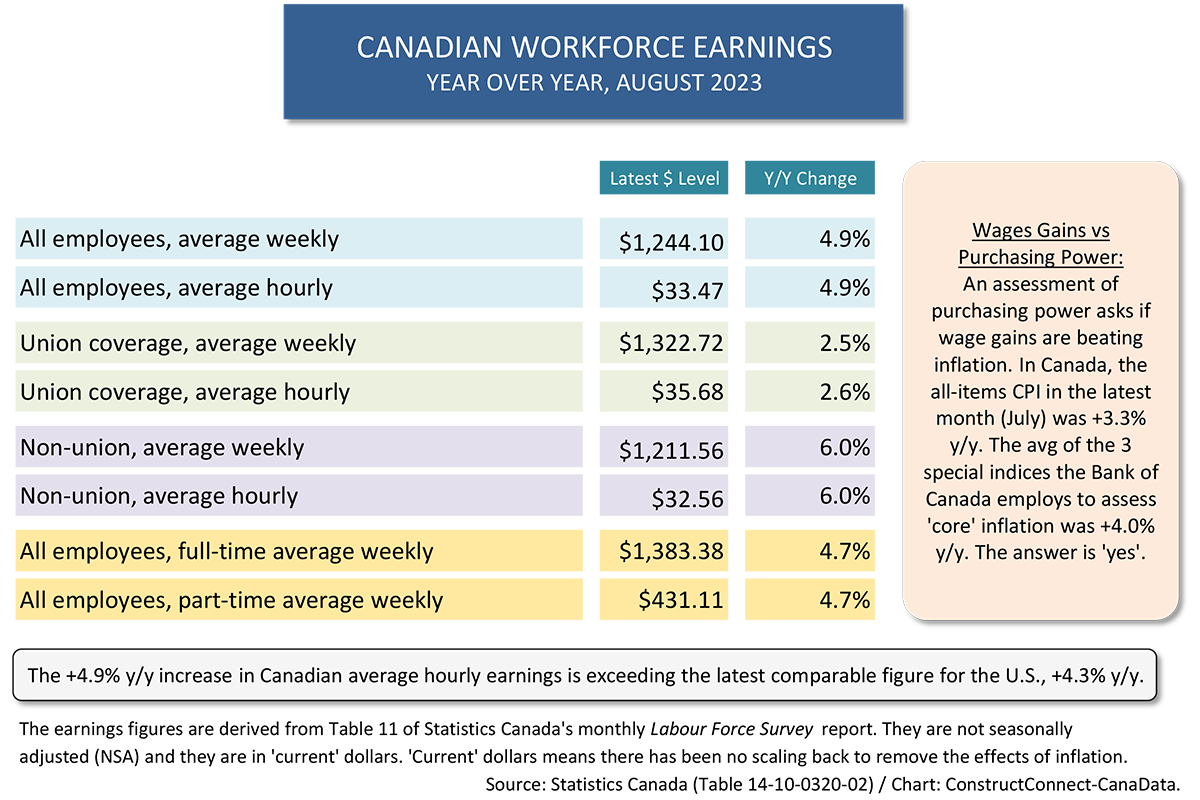
Table 2
Graph 3
Alex Carrick is Chief Economist for ║┌┴¤╔þConnect. He has delivered presentations throughout North America on the U.S., Canadian and world construction outlooks. Mr. Carrick has been with the company since 1985. Links to his numerous articles are featured on Twitter╠², which has 50,000 followers.


Recent Comments
comments for this post are closed